TRANSLATING DATA INTO A VISUAL STORY OF IMPACT
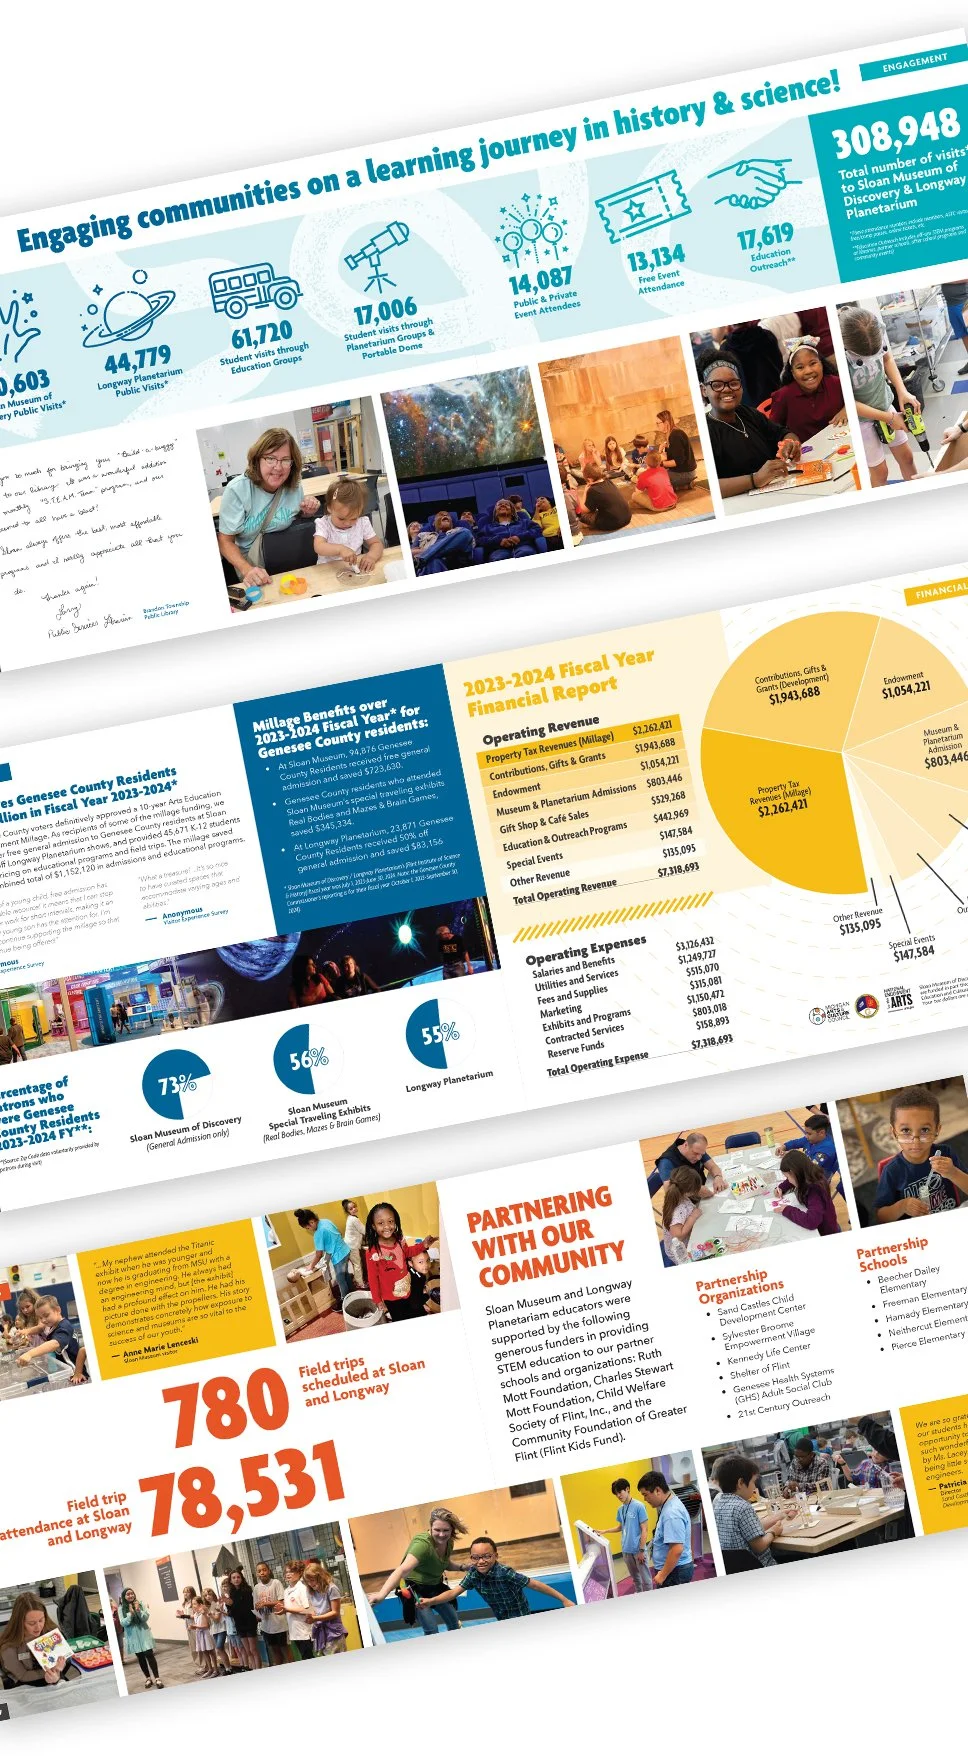
Infographic showing community engagement statistics, financial data, and photos of children and activities at a museum, highlighting education outreach, visitor numbers, and community partnerships.

Role: Editorial Design, Information Architecture & Data Visualization

Scope: The Annual Community Impact Report was developed to communicate the measurable reach, educational outcomes, and financial stewardship of Sloan Museum of Discovery and Longway Planetarium. I led the report’s visual and structural development from content synthesis through final layout, translating complex data, institutional reporting requirements, and community narratives into a cohesive publication. Rooted in the Sloan and Longway brand system, the design emphasizes clarity, hierarchy, and purposeful data visualization. The result is a structured, impact-centered report that aligns measurable outcomes with the lived experiences behind the numbers.

Timeline: Summer 2025

View the full report SloanLongway.org
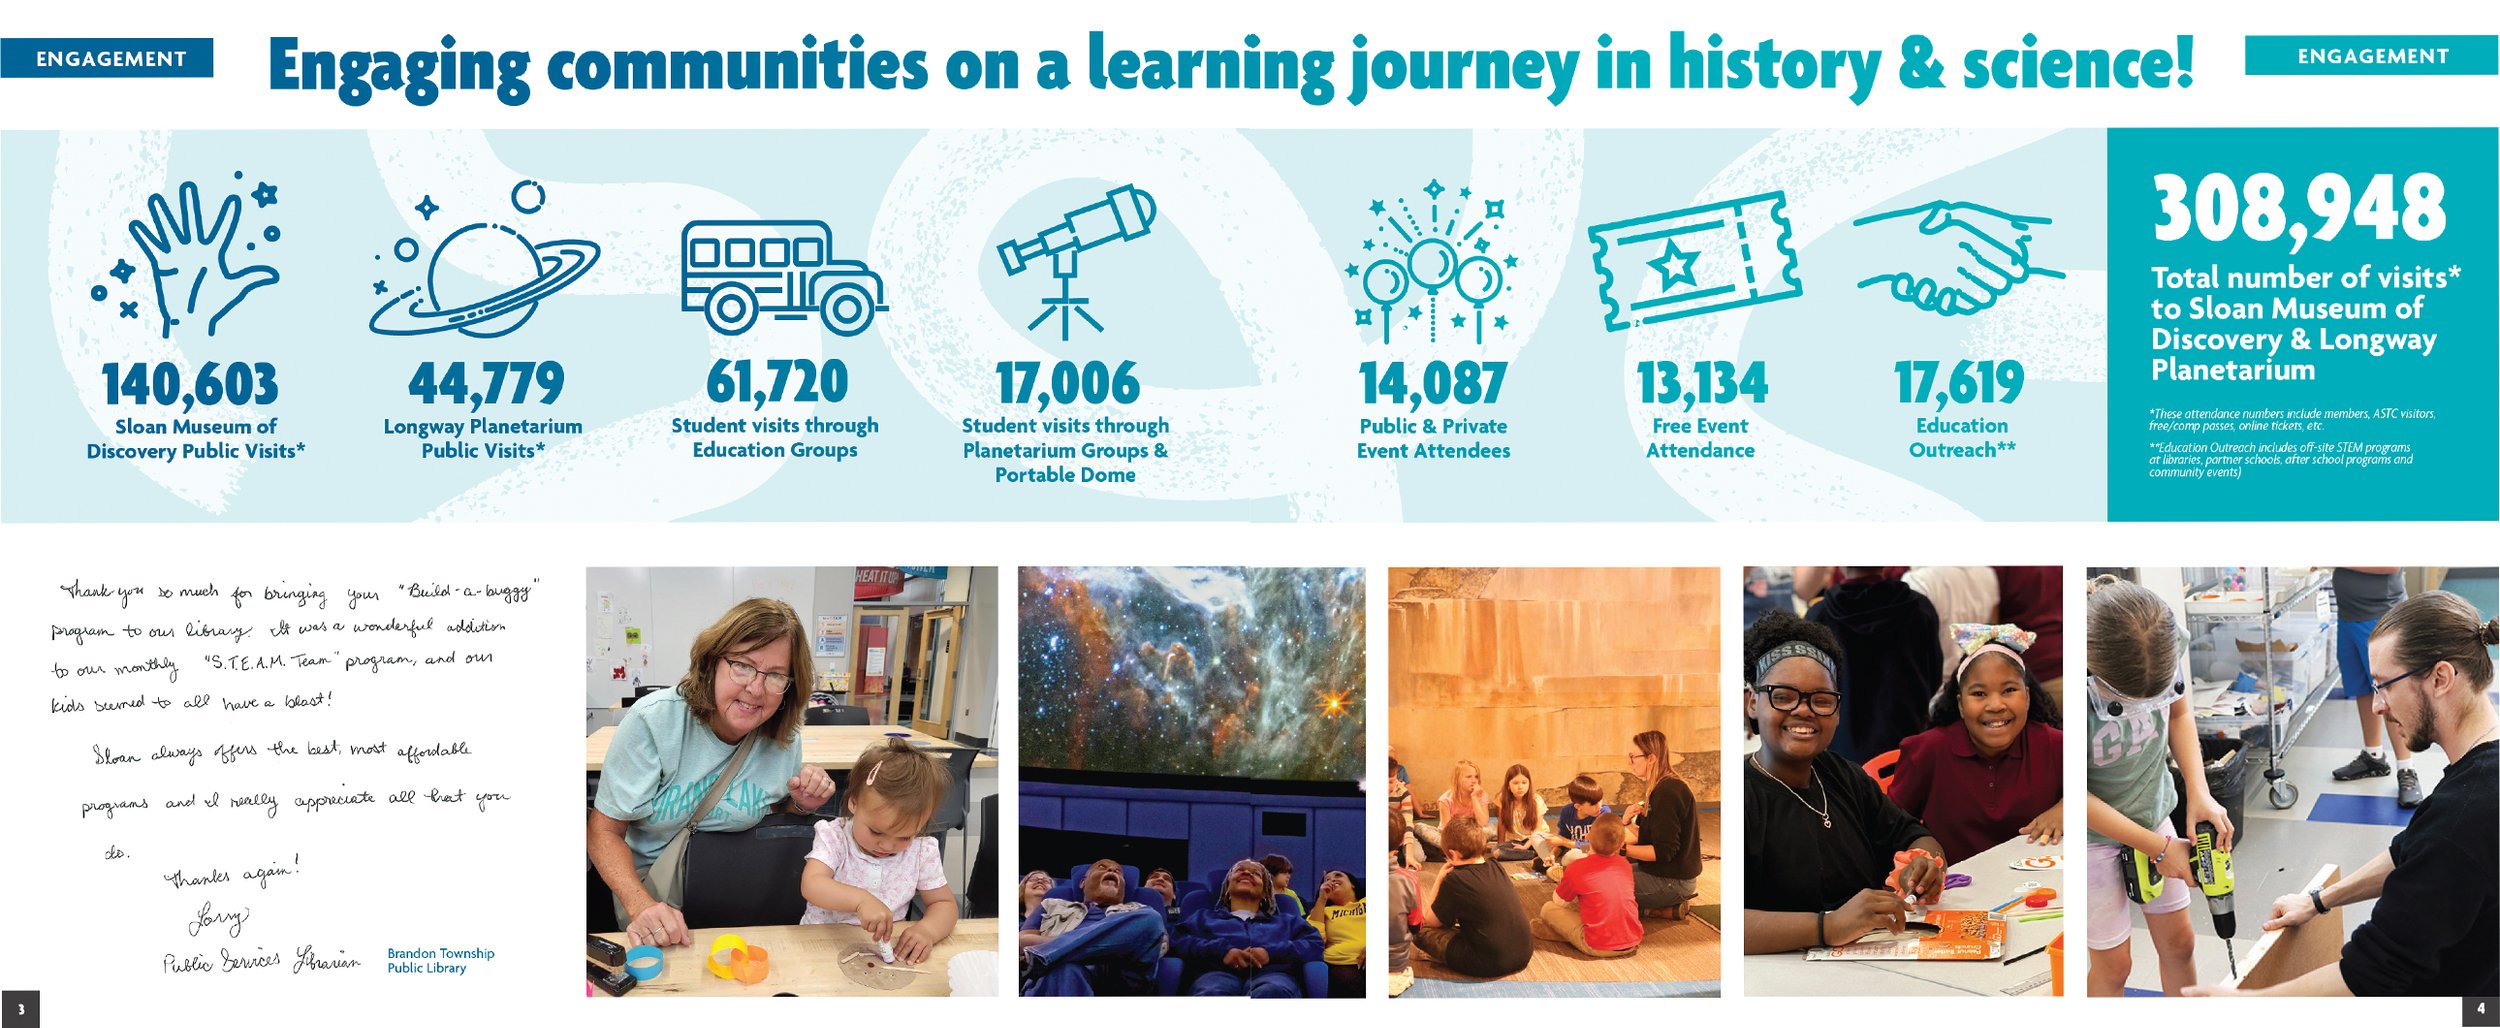
Infographic of community engagement and learning at Sloan Museum of Discovery and Longway Planetarium, showing visit statistics, and photos of children and educators participating in science activities.
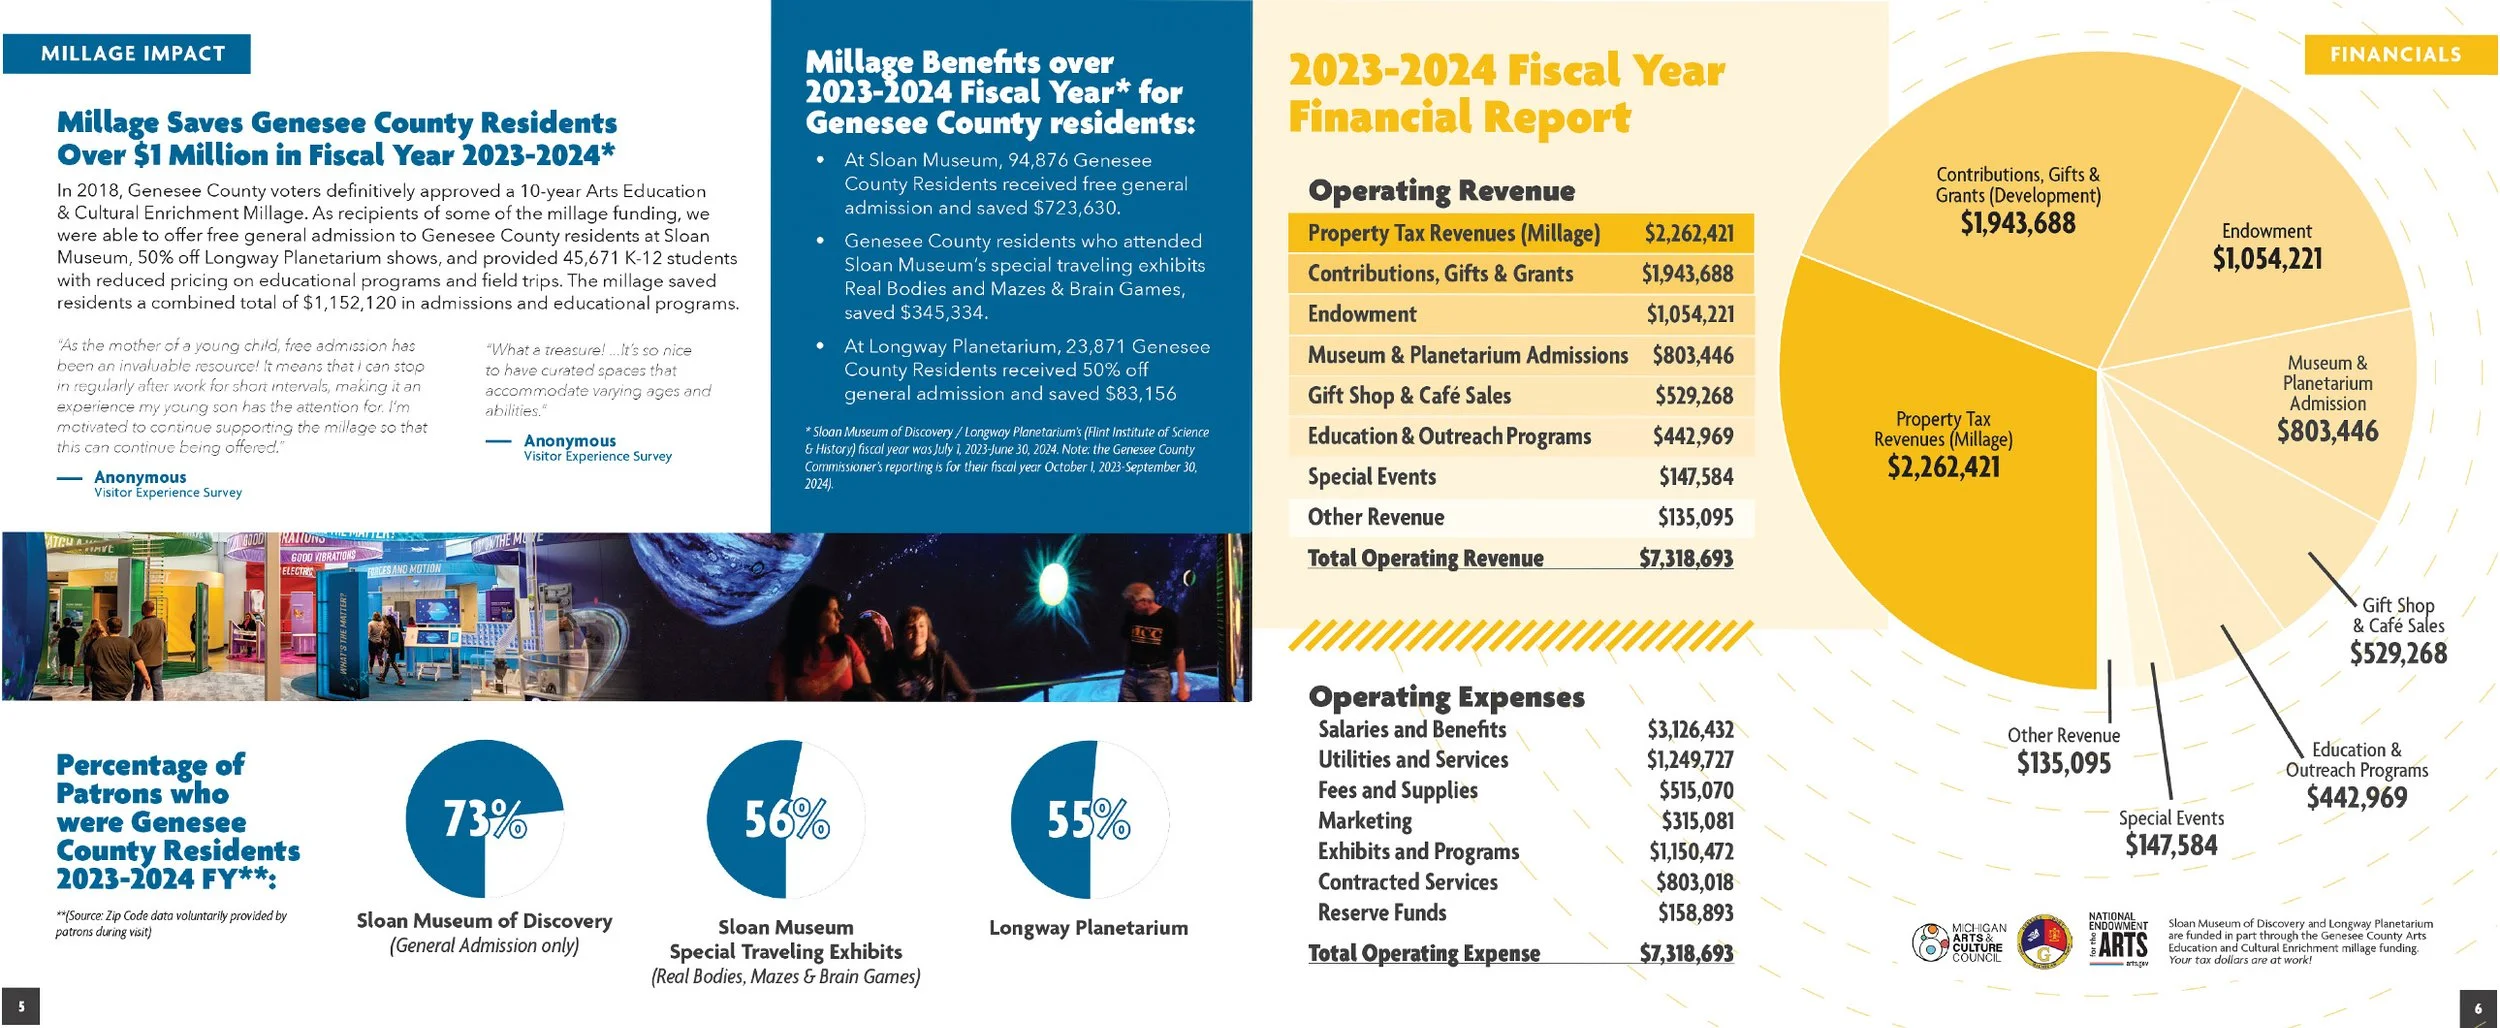
A graphic information report showing Millage benefits and finances for Genesee County residents for the 2023-2024 fiscal year, including details on tax revenues, expenses, and a pie chart of financial distribution.
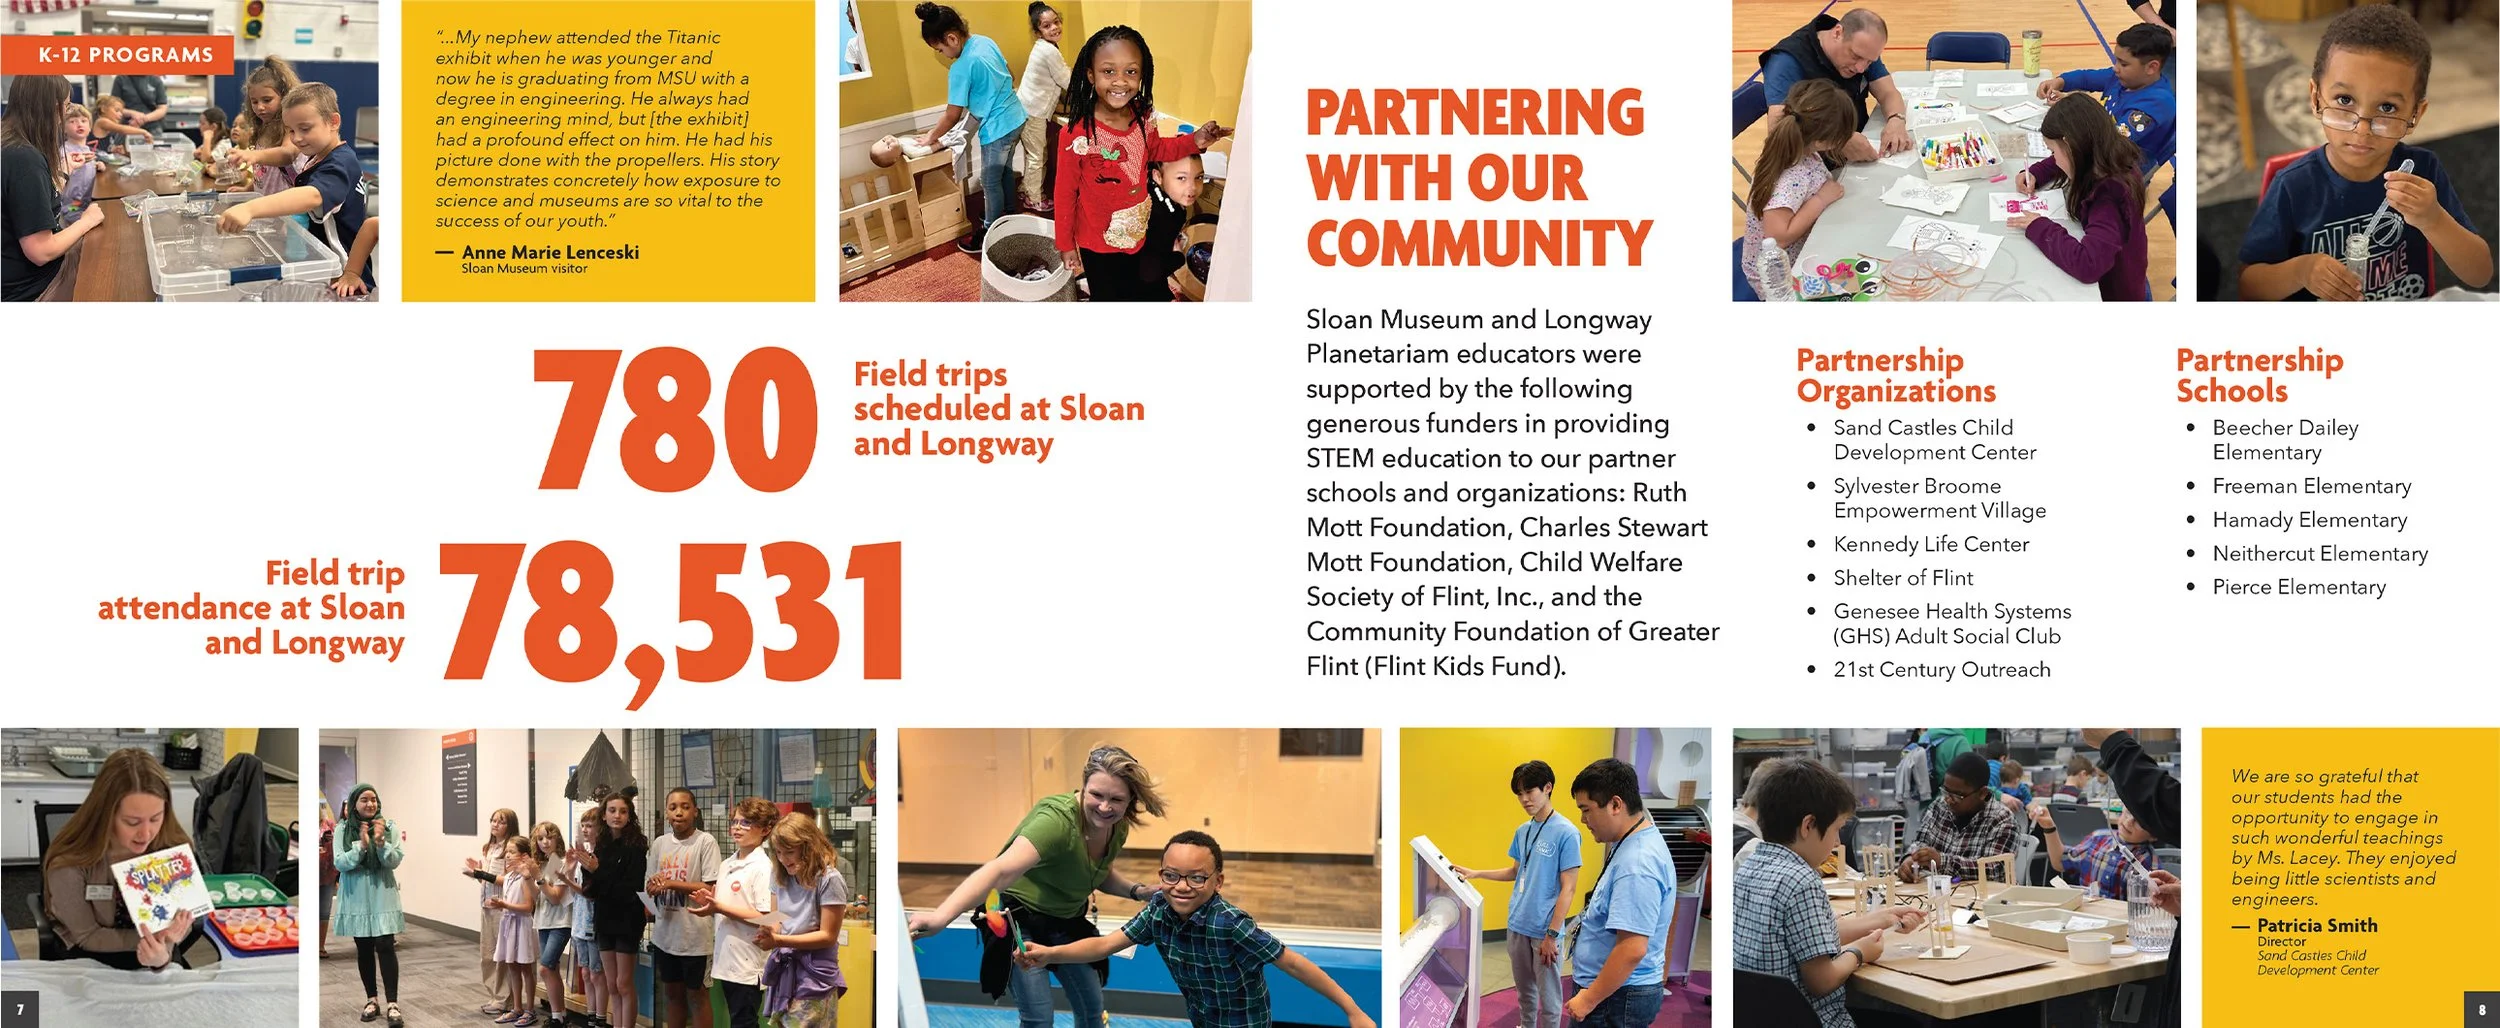
A collage of photos showing children engaging in STEM activities at a museum, including building, measuring, and playing with science kits, with a red and white informational text layout highlighting the museum's community partnerships and program statistics.